The deformed configuration
using FerriteTikzA linear elasticity problem
We solve a small cantilever under a tip load, straight out of the Ferrite tutorials, and then plot the result. Nothing here is FerriteTikz-specific yet.
grid = generate_grid(Quadrilateral, (20, 4), Vec{2}((0.0, -0.5)), Vec{2}((10.0, 0.5)))addfacetset!(grid, "clamped", x -> x[1] ≈ 0.0)addfacetset!(grid, "tip", x -> x[1] ≈ 10.0)ip = Lagrange{RefQuadrilateral, 1}()^2qr = QuadratureRule{RefQuadrilateral}(2)qr_face = FacetQuadratureRule{RefQuadrilateral}(2)cv = CellValues(qr, ip)fv = FacetValues(qr_face, ip)dh = DofHandler(grid)add!(dh, :u, ip)close!(dh)ch = ConstraintHandler(dh)add!(ch, Dirichlet(:u, getfacetset(grid, "clamped"), (x, t) -> [0.0, 0.0], [1, 2]))close!(ch)E, ν = 200.0e3, 0.3λ = E * ν / ((1 + ν) * (1 - 2ν))μ = E / (2 * (1 + ν))δ(i, j) = i == j ? 1.0 : 0.0C = SymmetricTensor{4, 2}((i, j, k, l) -> λ * δ(i, j) * δ(k, l) + μ * (δ(i, k) * δ(j, l) + δ(i, l) * δ(j, k)))K = allocate_matrix(dh)f = zeros(ndofs(dh))assembler = start_assemble(K, f)ke = zeros(ndofs_per_cell(dh), ndofs_per_cell(dh))fe = zeros(ndofs_per_cell(dh))for cell in CellIterator(dh) fill!(ke, 0) fill!(fe, 0) reinit!(cv, cell) for qp in 1:getnquadpoints(cv) dΩ = getdetJdV(cv, qp) for i in 1:getnbasefunctions(cv) ∇δu = shape_symmetric_gradient(cv, qp, i) for j in 1:getnbasefunctions(cv) ∇u = shape_symmetric_gradient(cv, qp, j) ke[i, j] += (∇δu ⊡ C ⊡ ∇u) * dΩ end end end # tip traction for facet in 1:nfacets(getcells(grid, cellid(cell))) if FacetIndex(cellid(cell), facet) in getfacetset(grid, "tip") reinit!(fv, cell, facet) for qp in 1:getnquadpoints(fv) dΓ = getdetJdV(fv, qp) for i in 1:getnbasefunctions(fv) fe[i] += (shape_value(fv, qp, i) ⋅ Vec{2}((0.0, -100.0))) * dΓ end end end end assemble!(assembler, celldofs(cell), ke, fe)endapply!(K, f, ch)u = K \ fPlotting it
Hand the DofHandler and the solution vector to tikzgrid. The nodal displacements are extracted with Ferrite.evaluate_at_grid_nodes, so the field may live on any interpolation:
tikzgrid(dh, u; field = :u, scale = 1.0, cellcolor = "blue!12", picturescale = 1.8)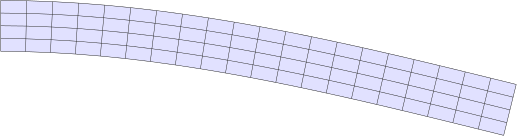
scale magnifies the displacement — the coordinates themselves are not scaled, so the picture keeps its physical size:
tikzgrid(dh, u; scale = 5.0, cellcolor = "blue!12", picturescale = 1.8)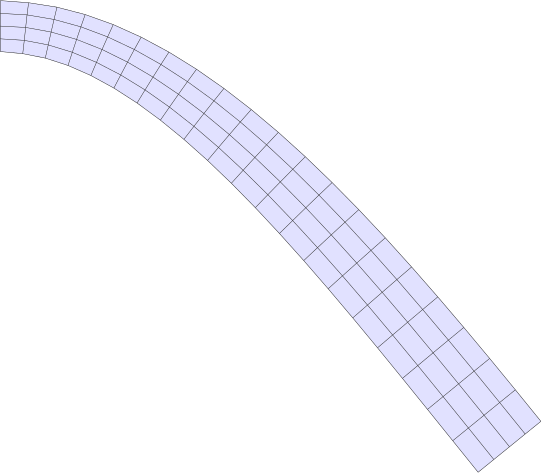
Overlaying the reference configuration
reference draws the undeformed grid underneath the deformed one. Give it the style it should be drawn in; everything not set explicitly is inherited from the main style, except that the reference configuration is never filled and carries no labels:
tikzgrid( dh, u; scale = 5.0, cellcolor = "blue!12", reference = (linecolor = "gray", linestyle = "dashed"), picturescale = 1.8,)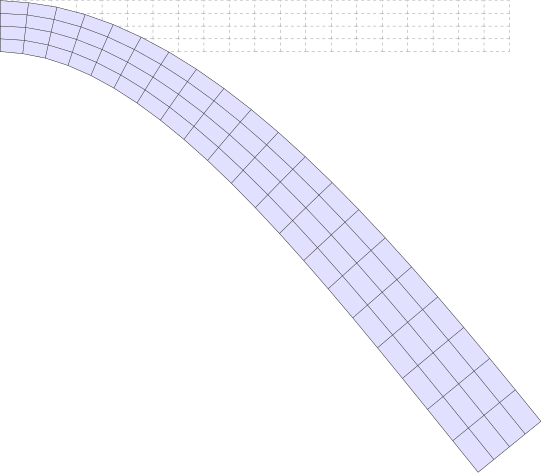
Pass reference = true to use the inherited style unchanged, and reference = nothing (the default) to draw the deformed configuration alone.
Passing displacements directly
A DofHandler is not required. Nodal displacements can be handed over as a Vector{Vec{2}} of length getnnodes(grid), or as a flat Vector{<:Real} of length 2 * getnnodes(grid) laid out as [u1x, u1y, u2x, u2y, …]:
grid2 = generate_grid(Quadrilateral, (10, 2), Vec{2}((0.0, -0.2)), Vec{2}((4.0, 0.2)))ud = [Vec{2}((0.0, 0.15 * x[1]^2)) for x in Ferrite.get_node_coordinate.((grid2,), 1:getnnodes(grid2))]tikzgrid(grid2, ud; scale = 1.0, cellcolor = "green!12", reference = true, picturescale = 4)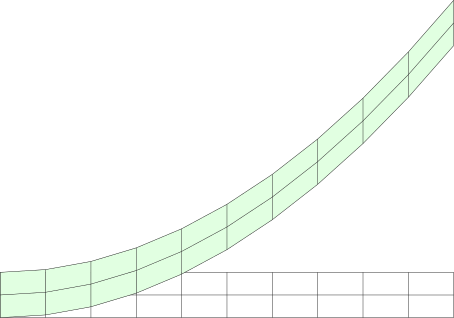
deformedcoordinates and nodedisplacements expose the same conversion if you want the coordinates for something else.
More than two configurations
reference covers the common case of one undeformed and one deformed state. For a whole load history, open a picture with setupMultiPlot, append one layer per state with gridcode!, and close it with drawMultiPlot:
io, reg = setupMultiPlot()gridcode!(io, reg, grid, FerriteTikz.nodecoordinates(grid), GridStyle(linecolor = "gray", linestyle = "dashed"))for (factor, color) in zip((2.0, 3.5, 5.0), ("blue!30!black", "blue!60!white", "red")) gridcode!(io, reg, grid, deformedcoordinates(dh, u; scale = factor), GridStyle(linecolor = color))enddrawMultiPlot(io, reg; picturescale = 1.8)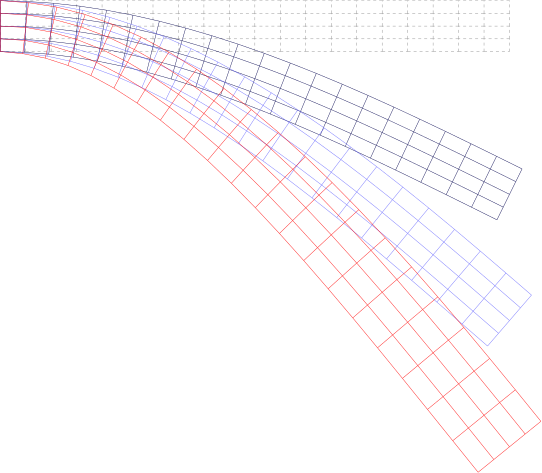
Each call appends one layer in drawing order with its own GridStyle, so the layers can differ in colour, line style, fills and labels. Sharing the single registry is what keeps a Colors.Colorant used by several layers down to one \definecolor statement.