Colouring cells by cell set
using FerriteTikzusing ColorsFerriteTikz only does flat, constant colouring: every cell is filled with a single colour. That is deliberate — it is what mesh, domain and material figures need, and it keeps the emitted TikZ small and hand-editable.
A uniform fill
grid = generate_grid(Quadrilateral, (8, 4))tikzgrid(grid; cellcolor = "blue!12", picturescale = 6.5)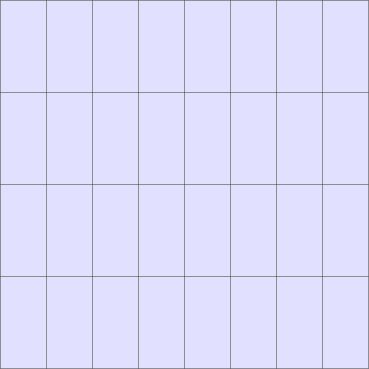
Per cell set colours
cellsetcolors maps names of Ferrite cell sets to colours. Cells that are not in any of the listed sets keep cellcolor:
grid = generate_grid(Quadrilateral, (8, 4))addcellset!(grid, "steel", x -> x[1] <= -0.25)addcellset!(grid, "rubber", x -> x[1] >= 0.25)tikzgrid( grid; cellsetcolors = ["steel" => "gray!35", "rubber" => colorant"#fb9a99"], cellcolor = "white", picturescale = 6.5,)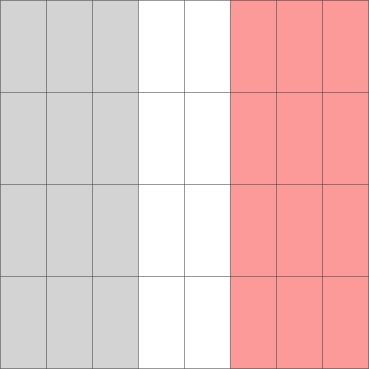
Pass the sets as a vector of pairs when the order matters: if a cell belongs to several listed sets, the last matching pair wins. A Dict works too, but its iteration order is unspecified, so only use one when the sets are disjoint.
Colour values
Two kinds of colours are accepted:
- an xcolor expression as a
String, e.g."blue!20","red!50!black","white", or any colour name your document defines — passed through verbatim; - any
Colors.Colorant, e.g.colorant"#a6cee3"orRGB(0.2, 0.4, 0.9)— emitted as a\definecolorstatement in the preamble of the picture.
p = tikzgrid(grid; cellcolor = colorant"#a6cee3")print(p.preamble)\definecolor{ftcolor1}{RGB}{166,206,227}This means a qualitative palette can be reused directly:
using Colorsgrid = generate_grid(Triangle, (6, 6))for (i, name) in enumerate(("a", "b", "c", "d")) addcellset!(grid, name, filter(cellid -> mod1(cellid, 4) == i, 1:getncells(grid)))endpalette = distinguishable_colors(4, [RGB(1, 1, 1)]; dropseed = true)tikzgrid( grid; cellsetcolors = [name => c for (name, c) in zip(("a", "b", "c", "d"), palette)], fillopacity = 0.5, picturescale = 6.5,)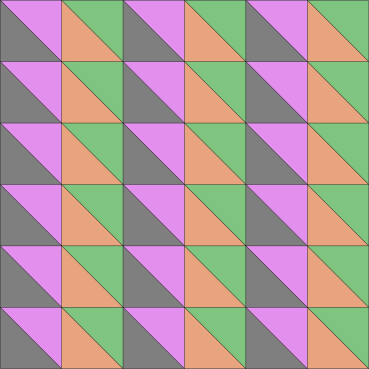
fillopacity makes the fills translucent, which is useful when the figure is placed on a coloured background or overlaid on something else.
Fills without a wireframe, and vice versa
drawcells = false drops the wireframe and leaves only the filled cells, which turns the mesh into a plain map of its regions:
grid = generate_grid(Quadrilateral, (8, 4))addcellset!(grid, "inclusion", x -> abs(x[1]) <= 0.5 && abs(x[2]) <= 0.5)tikzgrid( grid; cellcolor = "gray!25", cellsetcolors = ["inclusion" => "black!70"], drawcells = false, picturescale = 6.5,)">
<path fill-rule="nonzero" fill="rgb(87.5%25, 87.5%25, 87.5%25)" fill-opacity="1" d="M -0.00390625 368.003906 L 46 368.003906 L 46 276 L -0.00390625 276 Z M -0.00390625 368.003906 "/>
</g>
<g clip-path="url(%23clip-1787311781204842--1)">
<path fill-rule="nonzero" fill="rgb(87.5%25, 87.5%25, 87.5%25)" fill-opacity="1" d="M 46 368.003906 L 92 368.003906 L 92 276 L 46 276 Z M 46 368.003906 "/>
</g>
<g clip-path="url(%23clip-1787311781204842--2)">
<path fill-rule="nonzero" fill="rgb(87.5%25, 87.5%25, 87.5%25)" fill-opacity="1" d="M 92 368.003906 L 138 368.003906 L 138 276 L 92 276 Z M 92 368.003906 "/>
</g>
<g clip-path="url(%23clip-1787311781204842--3)">
<path fill-rule="nonzero" fill="rgb(87.5%25, 87.5%25, 87.5%25)" fill-opacity="1" d="M 138 368.003906 L 184.003906 368.003906 L 184.003906 276 L 138 276 Z M 138 368.003906 "/>
</g>
<g clip-path="url(%23clip-1787311781204842--4)">
<path fill-rule="nonzero" fill="rgb(87.5%25, 87.5%25, 87.5%25)" fill-opacity="1" d="M 184.003906 368.003906 L 230.003906 368.003906 L 230.003906 276 L 184.003906 276 Z M 184.003906 368.003906 "/>
</g>
<g clip-path="url(%23clip-1787311781204842--5)">
<path fill-rule="nonzero" fill="rgb(87.5%25, 87.5%25, 87.5%25)" fill-opacity="1" d="M 230.003906 368.003906 L 276.003906 368.003906 L 276.003906 276 L 230.003906 276 Z M 230.003906 368.003906 "/>
</g>
<g clip-path="url(%23clip-1787311781204842--6)">
<path fill-rule="nonzero" fill="rgb(87.5%25, 87.5%25, 87.5%25)" fill-opacity="1" d="M 276.003906 368.003906 L 322.003906 368.003906 L 322.003906 276 L 276.003906 276 Z M 276.003906 368.003906 "/>
</g>
<g clip-path="url(%23clip-1787311781204842--7)">
<path fill-rule="nonzero" fill="rgb(87.5%25, 87.5%25, 87.5%25)" fill-opacity="1" d="M 322.003906 368.003906 L 368.007812 368.003906 L 368.007812 276 L 322.003906 276 Z M 322.003906 368.003906 "/>
</g>
<path fill-rule="nonzero" fill="rgb(87.5%25, 87.5%25, 87.5%25)" fill-opacity="1" d="M -0.00390625 276 L 46 276 L 46 184 L -0.00390625 184 Z M -0.00390625 276 "/>
<path fill-rule="nonzero" fill="rgb(87.5%25, 87.5%25, 87.5%25)" fill-opacity="1" d="M 46 276 L 92 276 L 92 184 L 46 184 Z M 46 276 "/>
<path fill-rule="nonzero" fill="rgb(29.998779%25, 29.998779%25, 29.998779%25)" fill-opacity="1" d="M 92 276 L 138 276 L 138 184 L 92 184 Z M 92 276 "/>
<path fill-rule="nonzero" fill="rgb(29.998779%25, 29.998779%25, 29.998779%25)" fill-opacity="1" d="M 138 276 L 184.003906 276 L 184.003906 184 L 138 184 Z M 138 276 "/>
<path fill-rule="nonzero" fill="rgb(29.998779%25, 29.998779%25, 29.998779%25)" fill-opacity="1" d="M 184.003906 276 L 230.003906 276 L 230.003906 184 L 184.003906 184 Z M 184.003906 276 "/>
<path fill-rule="nonzero" fill="rgb(29.998779%25, 29.998779%25, 29.998779%25)" fill-opacity="1" d="M 230.003906 276 L 276.003906 276 L 276.003906 184 L 230.003906 184 Z M 230.003906 276 "/>
<path fill-rule="nonzero" fill="rgb(87.5%25, 87.5%25, 87.5%25)" fill-opacity="1" d="M 276.003906 276 L 322.003906 276 L 322.003906 184 L 276.003906 184 Z M 276.003906 276 "/>
<g clip-path="url(%23clip-1787311781204842--8)">
<path fill-rule="nonzero" fill="rgb(87.5%25, 87.5%25, 87.5%25)" fill-opacity="1" d="M 322.003906 276 L 368.007812 276 L 368.007812 184 L 322.003906 184 Z M 322.003906 276 "/>
</g>
<path fill-rule="nonzero" fill="rgb(87.5%25, 87.5%25, 87.5%25)" fill-opacity="1" d="M -0.00390625 184 L 46 184 L 46 91.996094 L -0.00390625 91.996094 Z M -0.00390625 184 "/>
<path fill-rule="nonzero" fill="rgb(87.5%25, 87.5%25, 87.5%25)" fill-opacity="1" d="M 46 184 L 92 184 L 92 91.996094 L 46 91.996094 Z M 46 184 "/>
<path fill-rule="nonzero" fill="rgb(29.998779%25, 29.998779%25, 29.998779%25)" fill-opacity="1" d="M 92 184 L 138 184 L 138 91.996094 L 92 91.996094 Z M 92 184 "/>
<path fill-rule="nonzero" fill="rgb(29.998779%25, 29.998779%25, 29.998779%25)" fill-opacity="1" d="M 138 184 L 184.003906 184 L 184.003906 91.996094 L 138 91.996094 Z M 138 184 "/>
<path fill-rule="nonzero" fill="rgb(29.998779%25, 29.998779%25, 29.998779%25)" fill-opacity="1" d="M 184.003906 184 L 230.003906 184 L 230.003906 91.996094 L 184.003906 91.996094 Z M 184.003906 184 "/>
<path fill-rule="nonzero" fill="rgb(29.998779%25, 29.998779%25, 29.998779%25)" fill-opacity="1" d="M 230.003906 184 L 276.003906 184 L 276.003906 91.996094 L 230.003906 91.996094 Z M 230.003906 184 "/>
<path fill-rule="nonzero" fill="rgb(87.5%25, 87.5%25, 87.5%25)" fill-opacity="1" d="M 276.003906 184 L 322.003906 184 L 322.003906 91.996094 L 276.003906 91.996094 Z M 276.003906 184 "/>
<g clip-path="url(%23clip-1787311781204842--9)">
<path fill-rule="nonzero" fill="rgb(87.5%25, 87.5%25, 87.5%25)" fill-opacity="1" d="M 322.003906 184 L 368.007812 184 L 368.007812 91.996094 L 322.003906 91.996094 Z M 322.003906 184 "/>
</g>
<path fill-rule="nonzero" fill="rgb(87.5%25, 87.5%25, 87.5%25)" fill-opacity="1" d="M -0.00390625 91.996094 L 46 91.996094 L 46 -0.0078125 L -0.00390625 -0.0078125 Z M -0.00390625 91.996094 "/>
<path fill-rule="nonzero" fill="rgb(87.5%25, 87.5%25, 87.5%25)" fill-opacity="1" d="M 46 91.996094 L 92 91.996094 L 92 -0.0078125 L 46 -0.0078125 Z M 46 91.996094 "/>
<path fill-rule="nonzero" fill="rgb(87.5%25, 87.5%25, 87.5%25)" fill-opacity="1" d="M 92 91.996094 L 138 91.996094 L 138 -0.0078125 L 92 -0.0078125 Z M 92 91.996094 "/>
<path fill-rule="nonzero" fill="rgb(87.5%25, 87.5%25, 87.5%25)" fill-opacity="1" d="M 138 91.996094 L 184.003906 91.996094 L 184.003906 -0.0078125 L 138 -0.0078125 Z M 138 91.996094 "/>
<path fill-rule="nonzero" fill="rgb(87.5%25, 87.5%25, 87.5%25)" fill-opacity="1" d="M 184.003906 91.996094 L 230.003906 91.996094 L 230.003906 -0.0078125 L 184.003906 -0.0078125 Z M 184.003906 91.996094 "/>
<path fill-rule="nonzero" fill="rgb(87.5%25, 87.5%25, 87.5%25)" fill-opacity="1" d="M 230.003906 91.996094 L 276.003906 91.996094 L 276.003906 -0.0078125 L 230.003906 -0.0078125 Z M 230.003906 91.996094 "/>
<path fill-rule="nonzero" fill="rgb(87.5%25, 87.5%25, 87.5%25)" fill-opacity="1" d="M 276.003906 91.996094 L 322.003906 91.996094 L 322.003906 -0.0078125 L 276.003906 -0.0078125 Z M 276.003906 91.996094 "/>
<g clip-path="url(%23clip-1787311781204842--10)">
<path fill-rule="nonzero" fill="rgb(87.5%25, 87.5%25, 87.5%25)" fill-opacity="1" d="M 322.003906 91.996094 L 368.007812 91.996094 L 368.007812 -0.0078125 L 322.003906 -0.0078125 Z M 322.003906 91.996094 "/>
</g>
</svg>)
Note that TikZ crops the picture to what is actually drawn: without the cellcolor above, only the eight cells of the inclusion would be emitted and the figure would shrink to that region instead of covering the whole domain.
addcellset!(grid, name, f) defaults to all = true, which selects a cell only when every one of its nodes satisfies f. A predicate that looks like it describes a region — say abs(x[2]) < 0.3 on a grid whose node rows sit at -1, -0.5, 0, 0.5, 1 — then matches no cell at all, Ferrite warns no entities added to the set, and the picture comes out blank. Pass all = false to select every cell touching the region, or give the cell ids explicitly, and check length(getcellset(grid, name)) if a fill goes missing.